
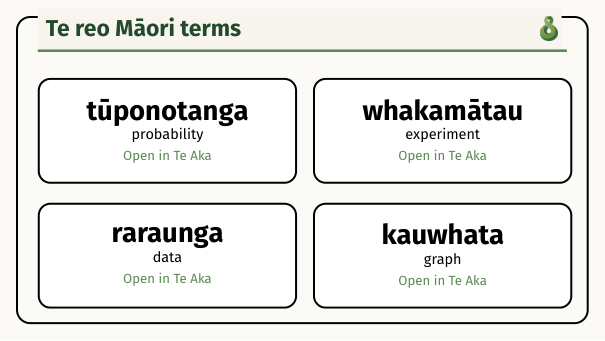
Te reo Māori terms
click each term to open in Te AkaLearning objective overview
Master Teaching Guide coverage for this objective.
Resources
- Alpha textbook: Frequency tables, Ex 33.03, pg 568-569
- Alpha textbook: Connecting experimental results with models of the
- Alpha textbook: possible outcomes, Ex 33.04, pg 571-572
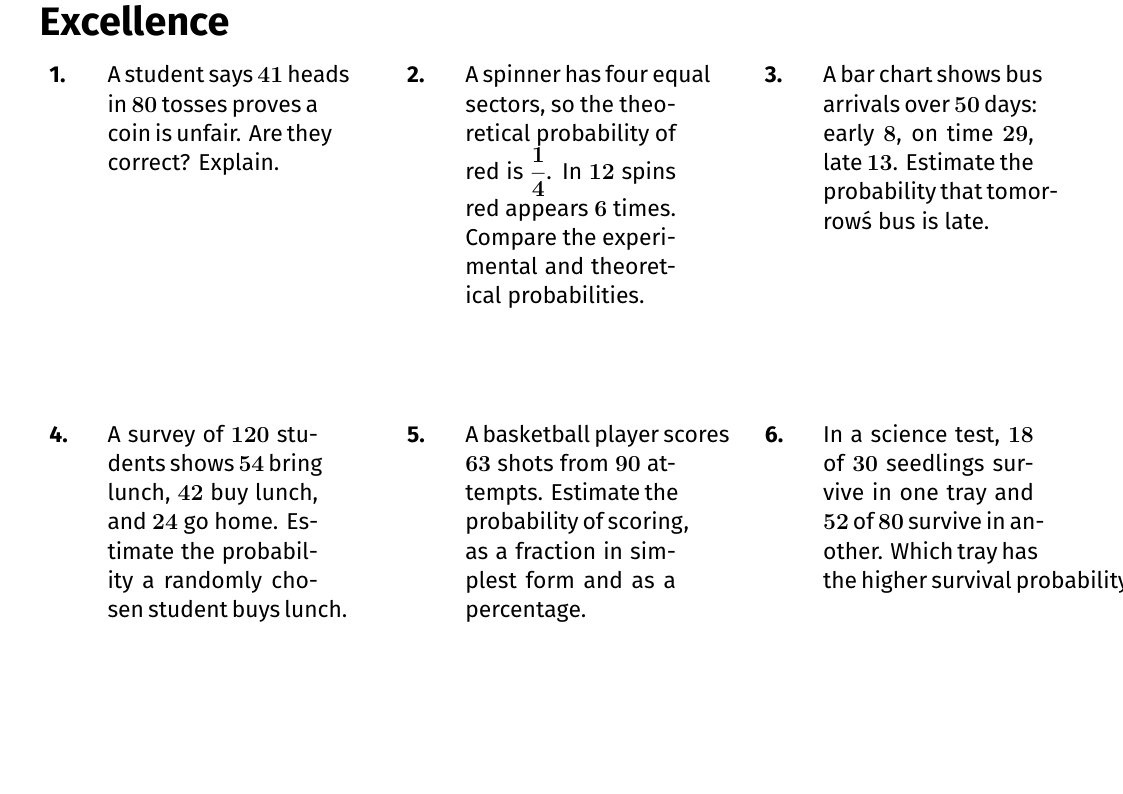
- Dr Austin Maths - Theoretical and Experimental Probability Revision Practice Grid: PDFQuestions PDF · Answers
Terminology
- experimental probability
- theoretical probability
- probability
- experiment
- trial
- outcome
- frequency
- statistical display
- bar chart
- tally chart
- data table
Task goals
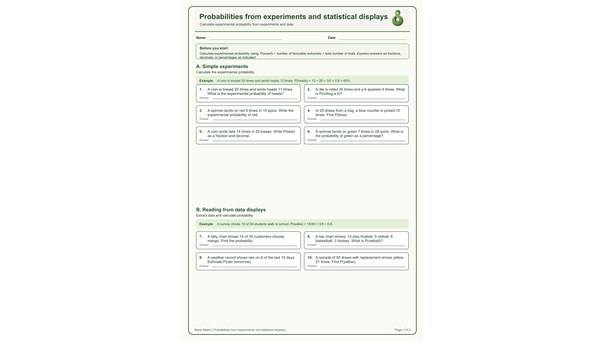
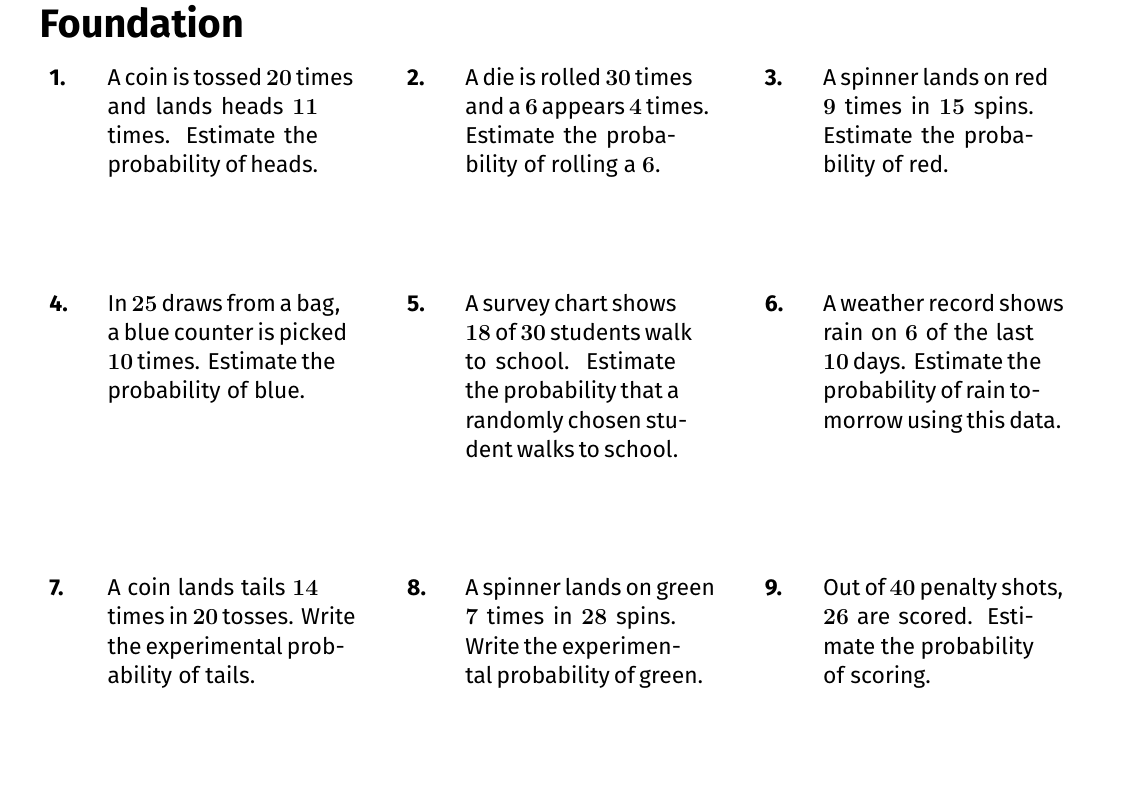
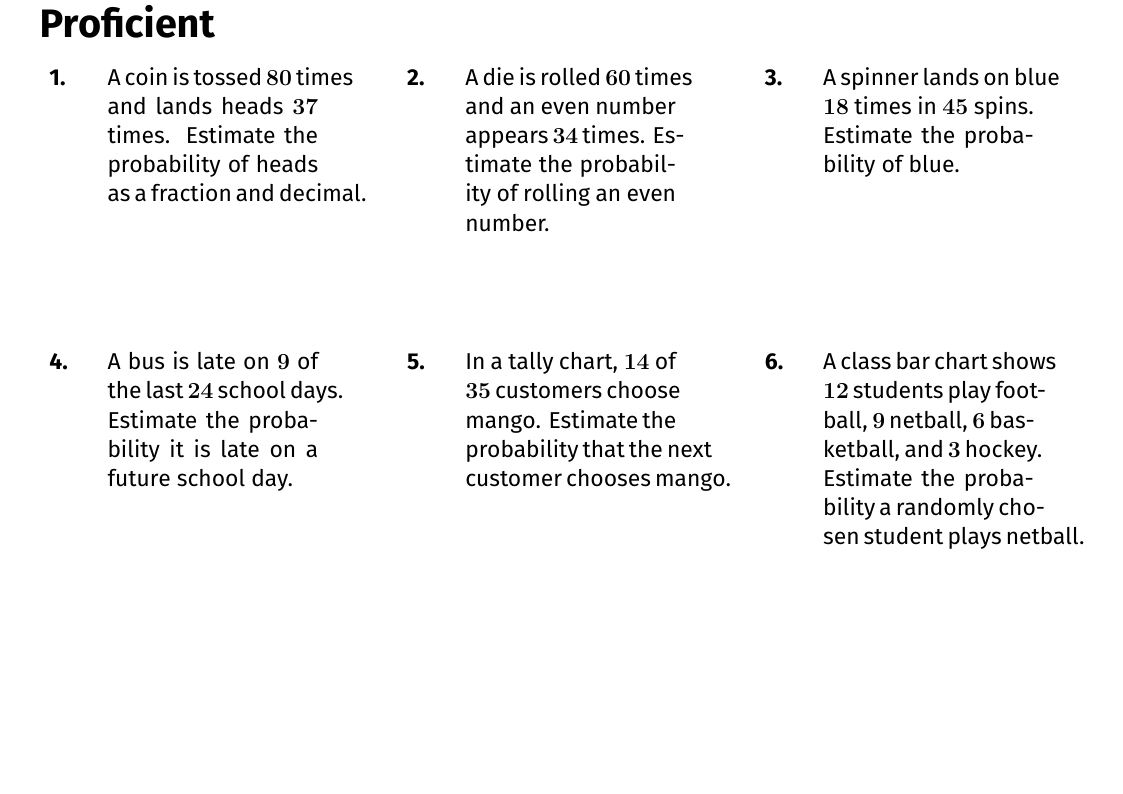
- Calculate experimental probability by counting favourable outcomes from an experiment and expressing it as a fraction, decimal, or percentage.
- Read and extract data from statistical displays (bar charts, tally charts, frequency tables) to estimate probabilities.
- Compare experimental probabilities with theoretical probabilities and explain whether observed results are reasonable.
- Justify conclusions about probability using data and evidence from an experiment or display.
Key skills
- Experimental probability
- Theoretical probability
- Frequency tables
- Data summary
Quick stats
- 81 total questions
- 3 difficulty levels
- Answers included
For teachers
Need the fuller teaching notes for this objective? Open the Teacher guidance PDF.